 Skip to main content
Valuation API
Retrieve valuation results through an API.
Use them to support pricing decisions when you value a property.
Real estate AI data services
SHIRUBE provides real estate companies and brokerages with a valuation API, asking prices per m² by building and by area, and listing trend data.
Use the data for valuations, acquisition decisions and client proposals.

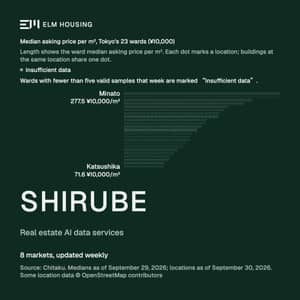
| Ward | Median |
|---|---|
| 277.5 | |
| 274.7 | |
| 227.3 | |
| 212.5 | |
| 185.4 | |
| 178.9 | |
| 170.4 | |
| 168.1 | |
| 147.1 | |
| 145.1 | |
| 138.1 | |
| 130.4 | |
| 120.7 | |
| 117.5 | |
| 117.4 | |
| 111.7 | |
| 104.7 | |
| 94.9 | |
| 89.0 | |
| 82.3 | |
| 81.0 | |
| 71.8 | |
| 71.6 |
| Ward | Median |
|---|---|
| Minato | 277.5 |
| Chiyoda | 274.7 |
| Shibuya | 227.3 |
| Chuo | 212.5 |
| Shinagawa | 185.4 |
| Meguro | 178.9 |
| Bunkyo | 170.4 |
| Shinjuku | 168.1 |
| Taito | 147.1 |
| Toshima | 145.1 |
| Koto | 138.1 |
| Setagaya | 130.4 |
| Sumida | 120.7 |
| Nakano | 117.5 |
| Suginami | 117.4 |
| Arakawa | 111.7 |
| Kita | 104.7 |
| Ota | 94.9 |
| Nerima | 89.0 |
| Edogawa | 82.3 |
| Itabashi | 81.0 |
| Adachi | 71.8 |
| Katsushika | 71.6 |
Length shows each ward’s median asking price per m². Each dot marks a building location. Buildings at the same location share one dot. Wards with a median are ordered from highest to lowest median asking price per m², followed by wards with insufficient data.
Source: Chitaku. Medians as of September 29, 2026; locations as of September 30, 2026. Some location data © OpenStreetMap contributors
Median asking price per m²277.5 ¥10,000/m²
Each dot marks a building location. Buildings at the same location share one dot.
We serve real estate companies and brokerages that use data for valuations, acquisitions and client proposals on existing condominiums.
Retrieve valuation results through an API.
Use them to support pricing decisions when you value a property.
We provide asking price statistics per m² for existing condominiums, grouped by building.
Review the asking price level of a building you are considering and use the data in client proposals.
We provide asking price statistics per m² by area.
Compare local price levels to inform acquisition decisions.
We provide data on new listings and changes in asking prices.
Use weekly trends to assess prices and explain market conditions to clients.
We cover eight markets: Tokyo’s 23 wards, Kanagawa, Chiba, Osaka, Kyoto, Aichi, Fukuoka and Hokkaido.
Data is updated weekly.
Data is available through an API or as data files.

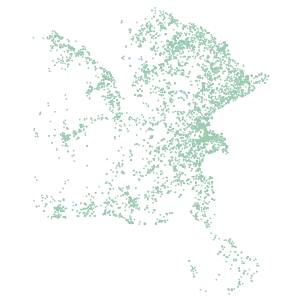
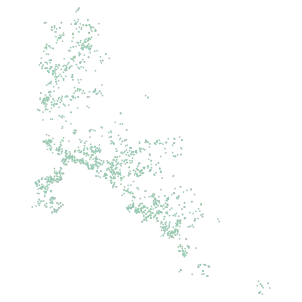
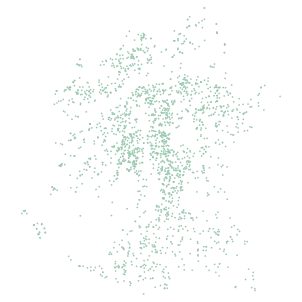


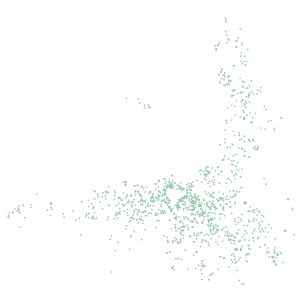
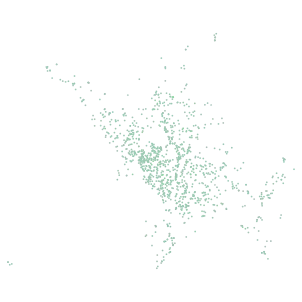
Source: Chitaku. Locations as of September 30, 2026. Some location data © OpenStreetMap contributors
Each dot marks a building location. Buildings at the same location share one dot.
| Reporting week | The week covered by the statistics |
|---|---|
| Aggregation level | By building or by area |
| Building or area | The building or area covered by the statistics |
| Asking price per m² | Asking price per m² statistics |
| New listing trends | Changes in newly listed properties |
| Price change trends | Changes in asking prices |
SHIRUBE runs on the same technology as the Chitaku real estate data platform. The technologies below support the data and its uses.
Chitaku Data Engine ZDE
Records a full snapshot of every tracked listing each week. Comparing snapshots shows new listings and price changes.
Z-Entity Resolution
Merges records that name the same building differently into a single building record, so listings can be viewed building by building.
Returns an estimated price per m² with a prediction interval, so each estimate comes with a range.
PDM
Tracks changes over time in the gap between asking prices and a reference price level.
Measures time on market and compares how building and area prices move against the wider market.
Grades how precisely each location is known, standardizes address formats and tests whether neighboring areas have similar price levels.
Tell us how you intend to use the data and which areas interest you.
We confirm the data you need and the delivery format.
Try a sample dataset or a trial to review the data provided.
Review the data scope and service terms, then sign.
You can use it for valuations of existing condominiums, acquisition decisions and client proposals.
We cover eight markets: Tokyo’s 23 wards, Kanagawa, Chiba, Osaka, Kyoto, Aichi, Fukuoka and Hokkaido.
Data is updated weekly.
SHIRUBE is a service for real estate companies and brokerages. Individuals can view listing activity for each building on Chitaku free of charge.
Visit chitaku.ai(opens in a new tab)Contact us about data for valuations, acquisition decisions or client proposals. We will review your inquiry and reply within 24 hours.
Other businesses